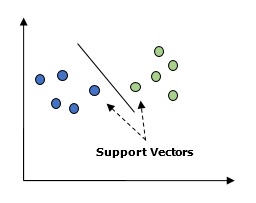
Basically, Support vector machine (SVM) is a supervised machine learning algorithm that can be used for both regression and classification. The main concept of SVM is to plot each data item as a point in n-dimensional space with the value of each feature being the value of a particular coordinate. Here n would be the features we would have. Following is a simple graphical representation to understand the concept of SVM −

In the above diagram, we have two features. Hence, we first need to plot these two variables in two dimensional space where each point has two co-ordinates, called support vectors. The line splits the data into two different classified groups. This line would be the classifier.
Here, we are going to build an SVM classifier by using scikit-learn and iris dataset. Scikitlearn library has the sklearn.svm module and provides sklearn.svm.svc for classification. The SVM classifier to predict the class of the iris plant based on 4 features are shown below.
Dataset
We will use the iris dataset which contains 3 classes of 50 instances each, where each class refers to a type of iris plant. Each instance has the four features namely sepal length, sepal width, petal length and petal width. The SVM classifier to predict the class of the iris plant based on 4 features is shown below.
Kernel
It is a technique used by SVM. Basically these are the functions which take low-dimensional input space and transform it to a higher dimensional space. It converts non-separable problem to separable problem. The kernel function can be any one among linear, polynomial, rbf and sigmoid. In this example, we will use the linear kernel.
Let us now import the following packages −
import pandas as pd
import numpy as np
from sklearn import svm, datasets
import matplotlib.pyplot as plt
Now, load the input data −
iris = datasets.load_iris()
We are taking first two features −
X = iris.data[:, :2]
y = iris.target
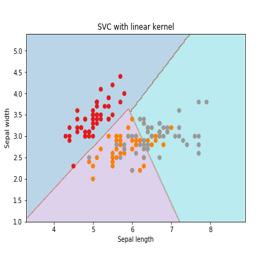
We will plot the support vector machine boundaries with original data. We are creating a mesh to plot.
x_min, x_max = X[:, 0].min() - 1, X[:, 0].max() + 1
y_min, y_max = X[:, 1].min() - 1, X[:, 1].max() + 1
h = (x_max / x_min)/100
xx, yy = np.meshgrid(np.arange(x_min, x_max, h),
np.arange(y_min, y_max, h))
X_plot = np.c_[xx.ravel(), yy.ravel()]
We need to give the value of regularization parameter.
C = 1.0
We need to create the SVM classifier object.
Svc_classifier = svm_classifier.SVC(kernel='linear',
C=C, decision_function_shape = 'ovr').fit(X, y)
Z = svc_classifier.predict(X_plot)
Z = Z.reshape(xx.shape)
plt.figure(figsize = (15, 5))
plt.subplot(121)
plt.contourf(xx, yy, Z, cmap = plt.cm.tab10, alpha = 0.3)
plt.scatter(X[:, 0], X[:, 1], c = y, cmap = plt.cm.Set1)
plt.xlabel('Sepal length')
plt.ylabel('Sepal width')
plt.xlim(xx.min(), xx.max())
plt.title('SVC with linear kernel')


No comments:
Post a Comment