A decision tree is basically a binary tree flowchart where each node splits a group of observations according to some feature variable.
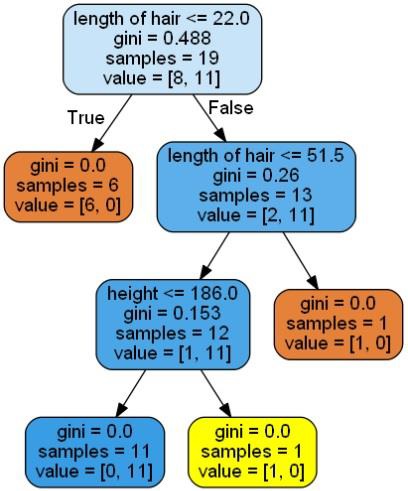
Here, we are building a Decision Tree classifier for predicting male or female. We will take a very small data set having 19 samples. These samples would consist of two features – ‘height’ and ‘length of hair’.
Prerequisite
For building the following classifier, we need to install pydotplus and graphviz. Basically, graphviz is a tool for drawing graphics using dot files and pydotplus is a module to Graphviz’s Dot language. It can be installed with the package manager or pip.
Now, we can build the decision tree classifier with the help of the following Python code −
To begin with, let us import some important libraries as follows −
import pydotplus
from sklearn import tree
from sklearn.datasets import load_iris
from sklearn.metrics import classification_report
from sklearn import cross_validation
import collections
Now, we need to provide the dataset as follows −
X = [[165,19],[175,32],[136,35],[174,65],[141,28],[176,15],[131,32],
[166,6],[128,32],[179,10],[136,34],[186,2],[126,25],[176,28],[112,38],
[169,9],[171,36],[116,25],[196,25]]
Y = ['Man','Woman','Woman','Man','Woman','Man','Woman','Man','Woman',
'Man','Woman','Man','Woman','Woman','Woman','Man','Woman','Woman','Man']
data_feature_names = ['height','length of hair']
X_train, X_test, Y_train, Y_test = cross_validation.train_test_split
(X, Y, test_size=0.40, random_state=5)
After providing the dataset, we need to fit the model which can be done as follows −
clf = tree.DecisionTreeClassifier()
clf = clf.fit(X,Y)
Prediction can be made with the help of the following Python code −
prediction = clf.predict([[133,37]])
print(prediction)
We can visualize the decision tree with the help of the following Python code −
dot_data = tree.export_graphviz(clf,feature_names = data_feature_names,
out_file = None,filled = True,rounded = True)
graph = pydotplus.graph_from_dot_data(dot_data)
colors = ('orange', 'yellow')
edges = collections.defaultdict(list)
for edge in graph.get_edge_list():
edges[edge.get_source()].append(int(edge.get_destination()))
for edge in edges: edges[edge].sort()
for i in range(2):dest = graph.get_node(str(edges[edge][i]))[0]
dest.set_fillcolor(colors[i])
graph.write_png('Decisiontree16.png')
It will give the prediction for the above code as [‘Woman’] and create the following decision tree −

We can change the values of features in prediction to test it.


No comments:
Post a Comment